Ymatou – E-commerce App
Ymatou is a cross-border e-commerce platform in China. In this project, I used heatmaps to identify issues in the purchase conversion process, collaborated with product managers to define requirements, and redesigned the information architecture and flow of the purchase page based on user research. As a result, the conversion rate increased by 1.32%.
My Role
My Team
Time period
May. 2020 to June.2020
UI Designer, Developer, Product Manager
Background
Heatmap, Funnel Model, User Persona, Scenario Description, User Journey, Design Analysis, Information Architecture, Prototype Design, Flowchart, and Wireframe.
UX
Skills
Process
Explore
01
Reframe
02
Create
03
Verify
04
Heatmap
User Persona
User Flow
User Experience Map
Information Architecture
Goal Breakdown
Flow Design
Prototype Design
Information Coupling
Conversion Funnel
Data Analysis
Heatmap
Explore
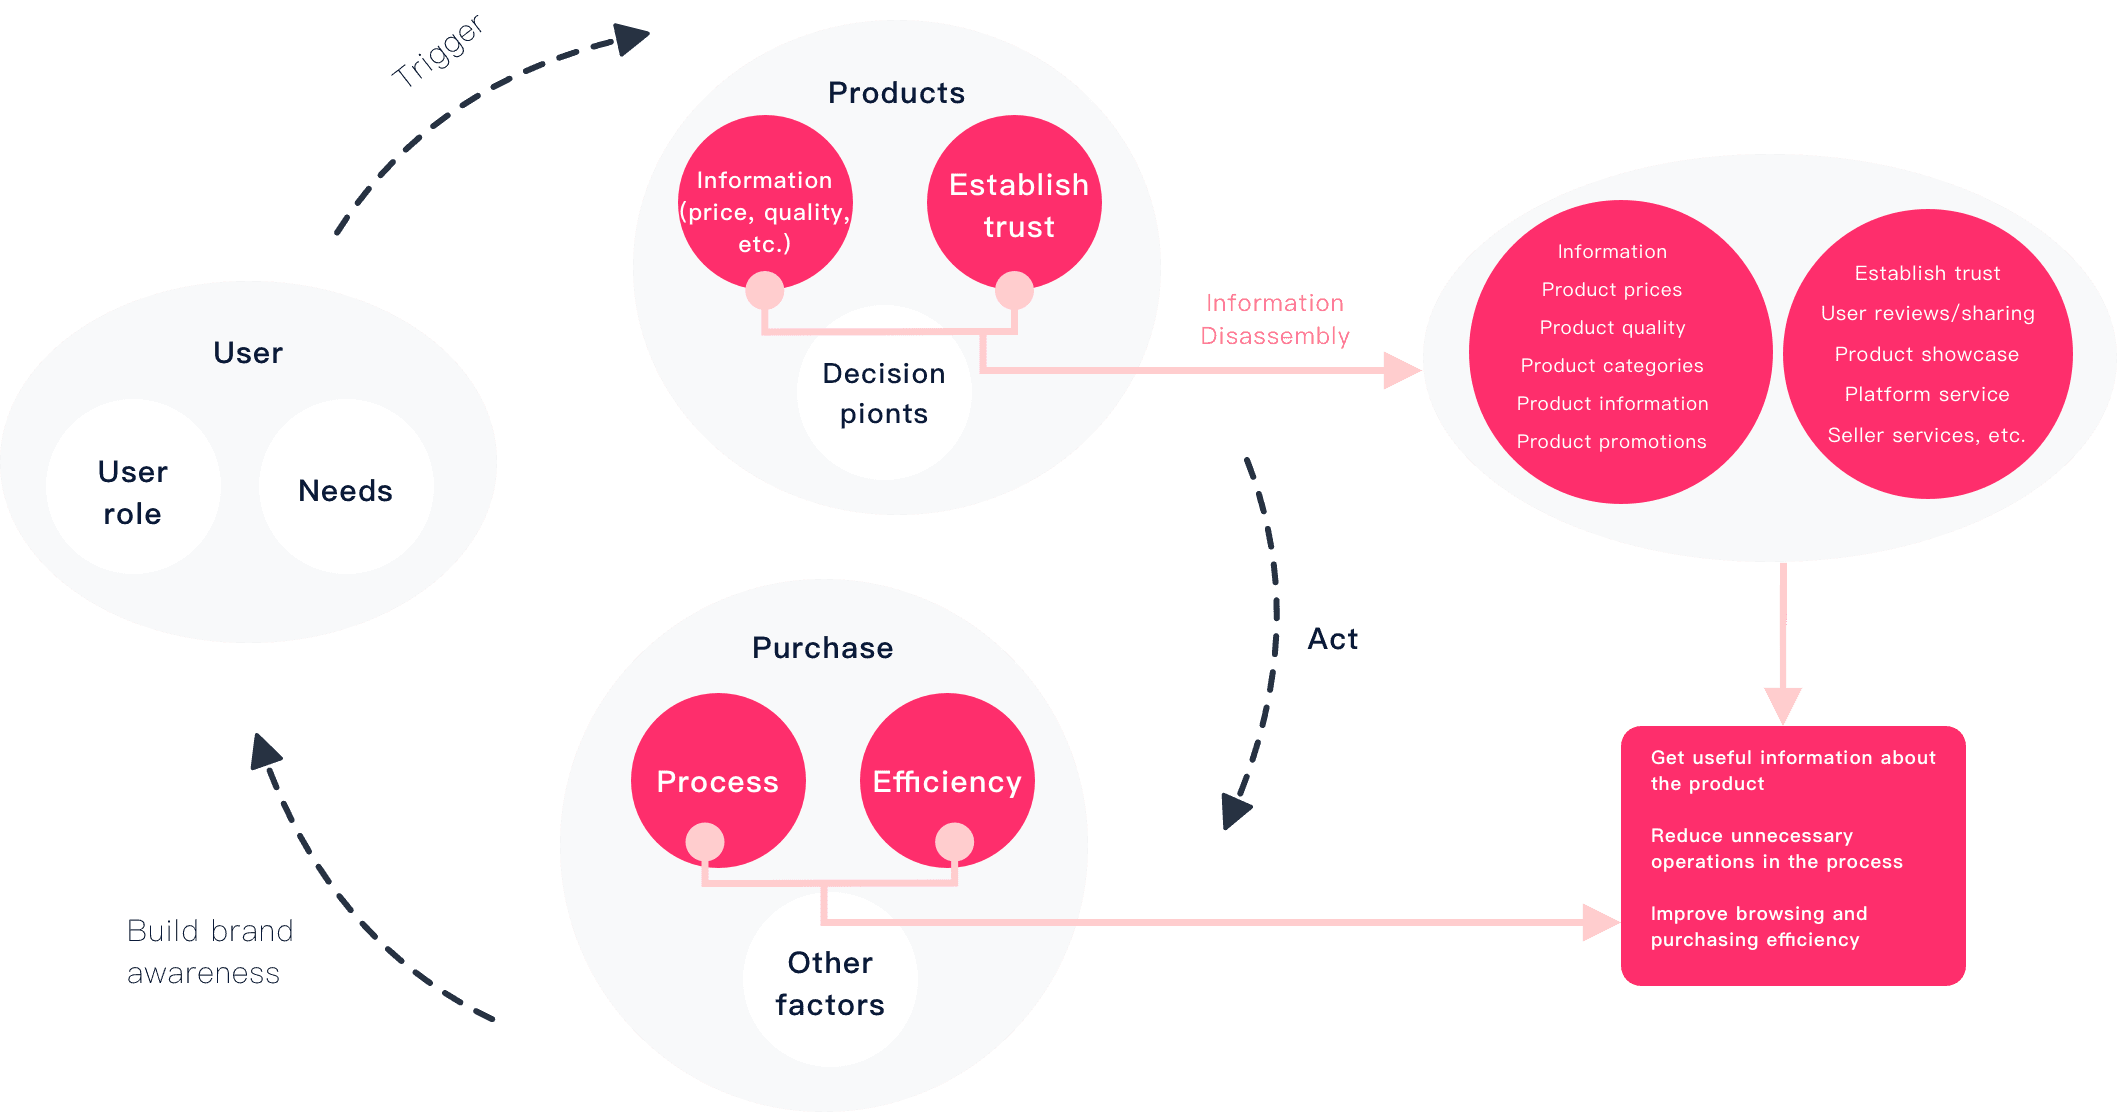
Explore user purchasing behavior and the factors that influence their buying decisions.
For e-commerce products, users make purchasing decisions based on the product and its price. Their needs drive their attention and browsing behavior. In the subsequent transaction process, factors such as trust, security, and the efficiency of offline product delivery also influence their decisions.
Combine product data analysis to validate the authenticity of user pain points.
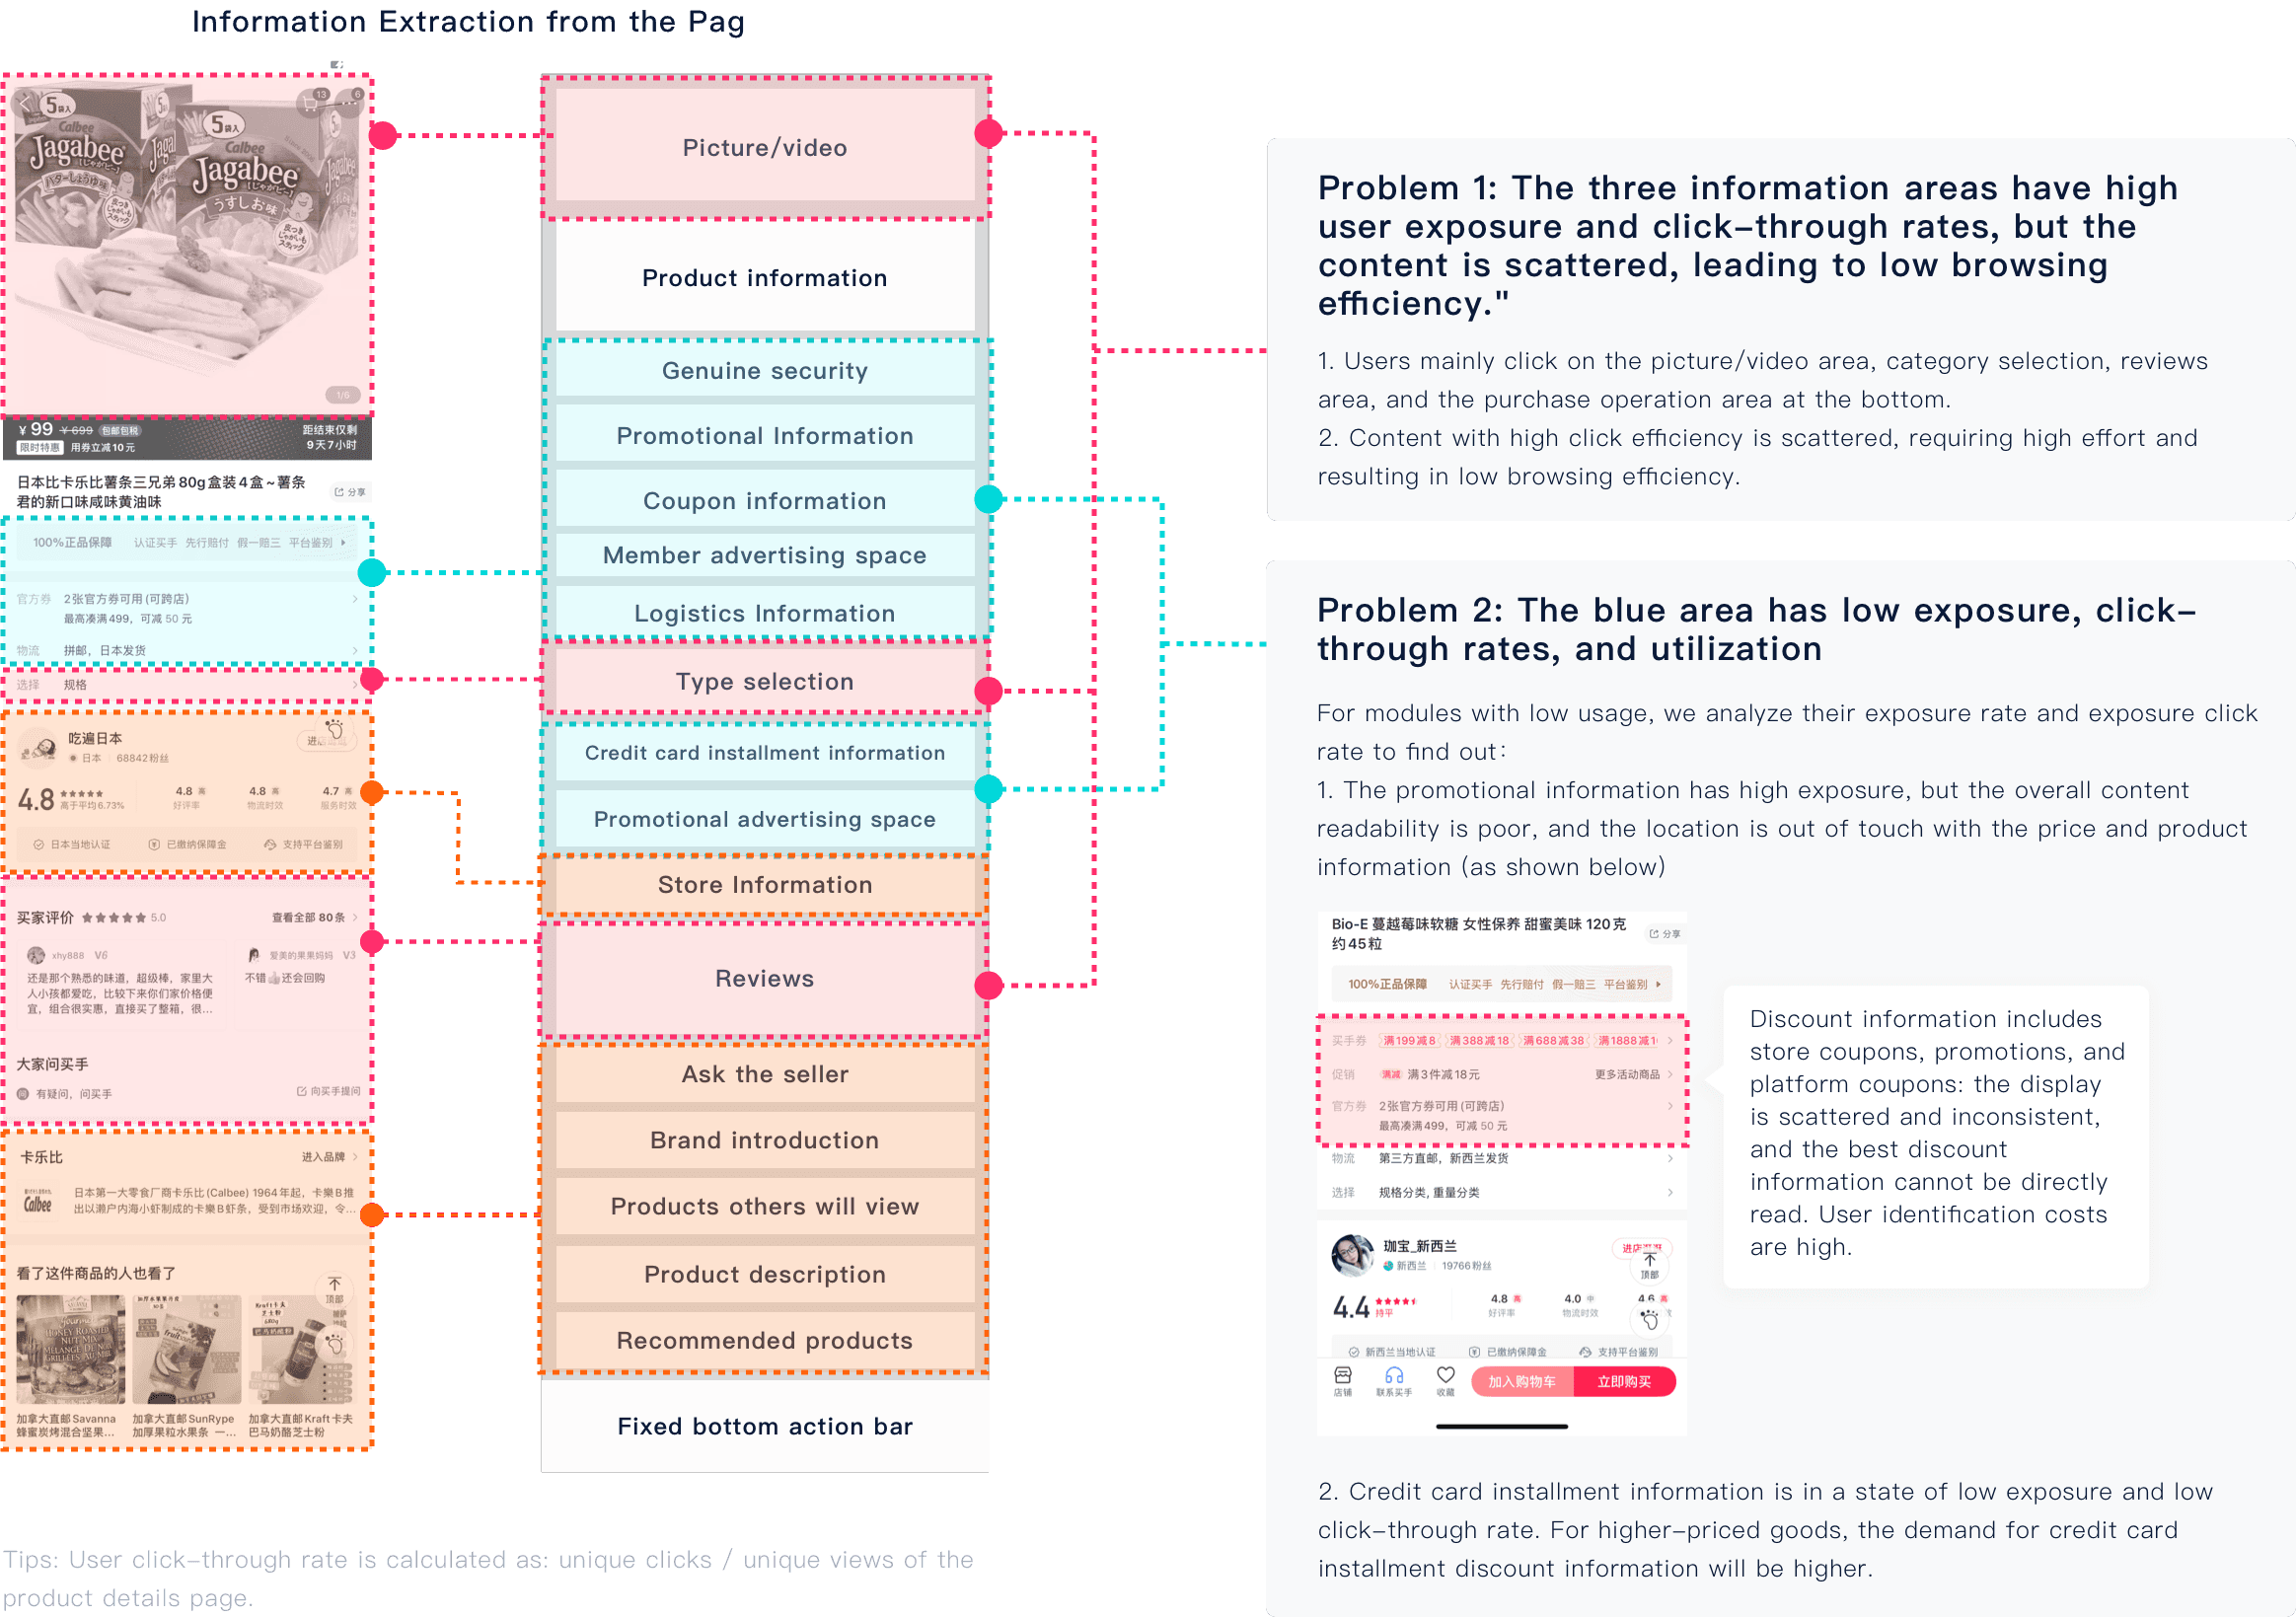
Findings and Summary
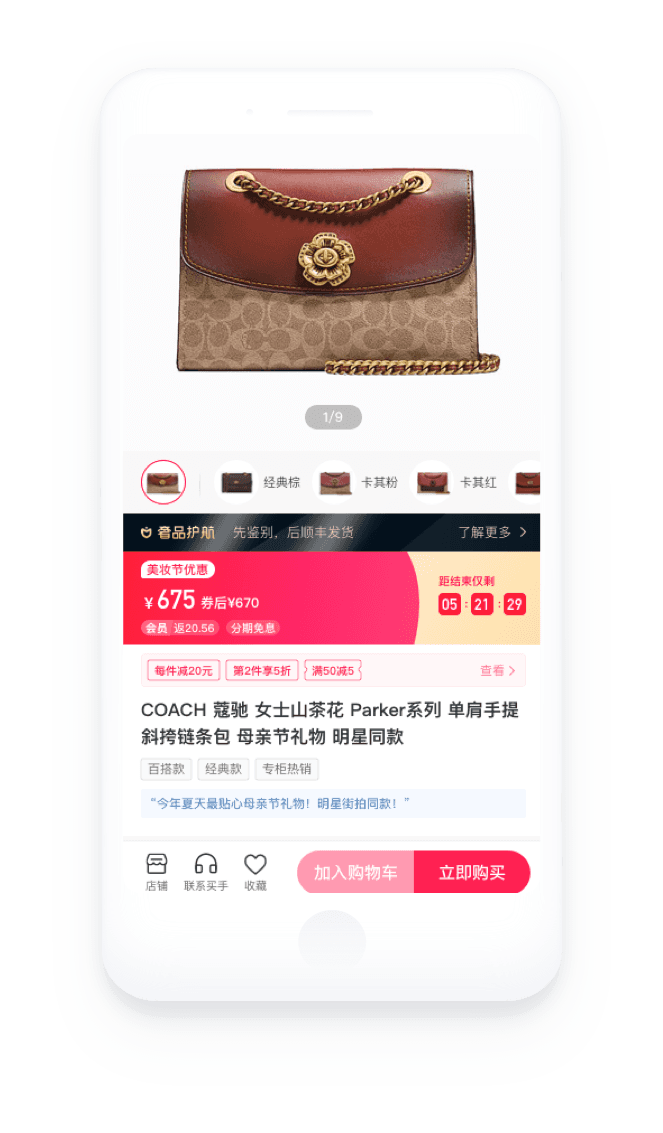
Users value images, videos, and reviews in product information.
The display contains content that users are not interested in, which takes up high exposure and occupies a large area.
Based on the above information, how can we help users view product information more efficiently?
Identify and analyze the key information that attracts customers to purchase, and reconstruct the users’ mental models.
1.Challenge
How to identify and analyze the key information that attracts customers to purchase, and reconstruct users’ mental models.
3.Experience Goals
Help users improve browsing efficiency, make purchase decisions, and reduce cognitive load.
2.Business Objectives
Increase the purchase conversion rate of new users and the repurchase rate of existing users.
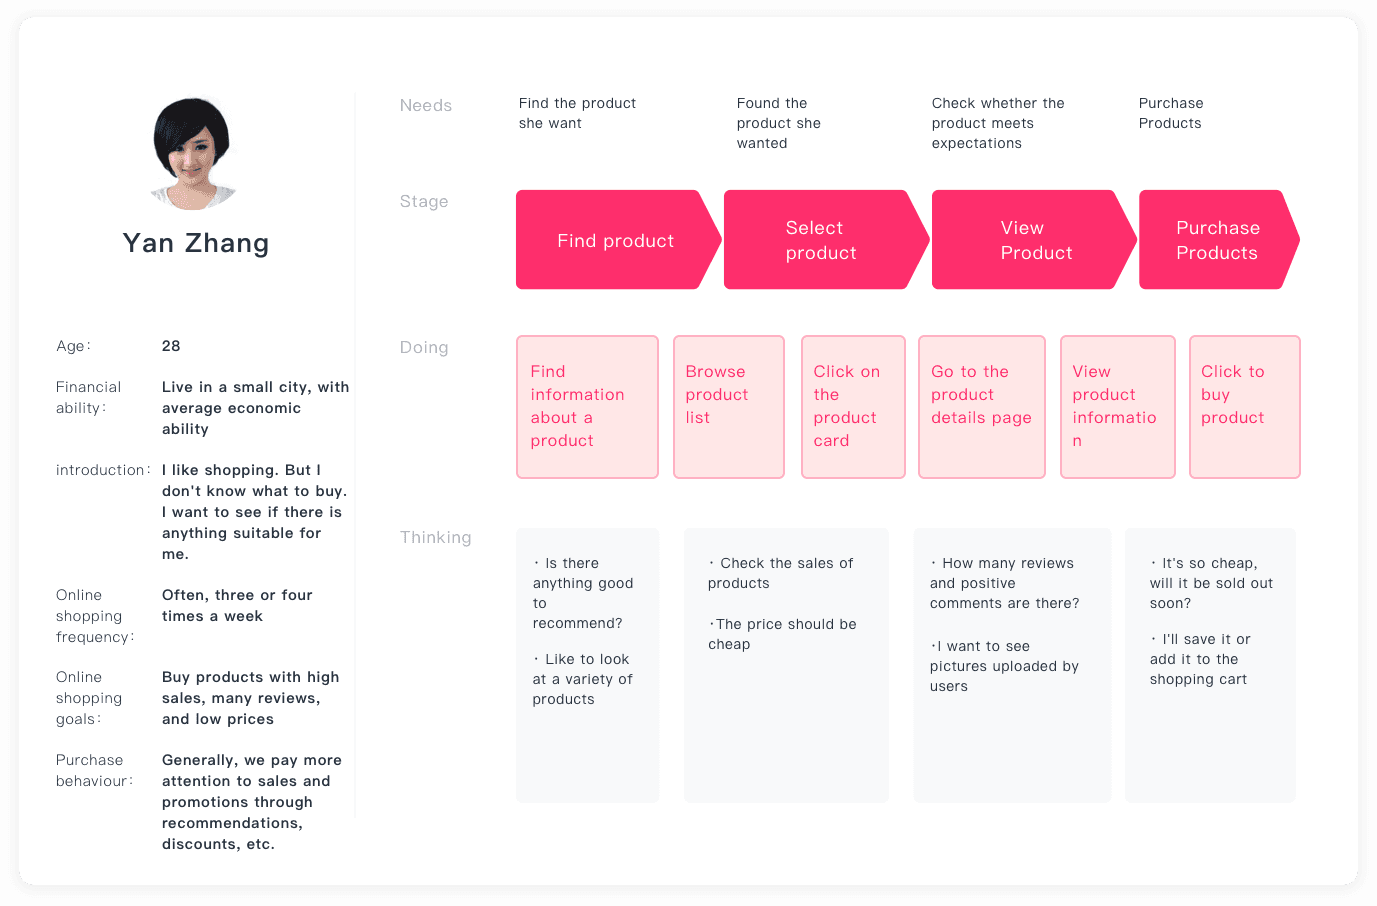
Understand Users: Simulate User Segmentation, Personas, and Journeys
Users are segmented based on two factors: needs and economic capacity. The reason for using these two factors is that needs represent the intensity of users’ demand for purchasing products, which is a key determinant of buying behavior. Economic capacity reflects users’ income and purchasing power, which also plays a crucial role in their decision-making.
User A: Yun Li
Strong demand, average economic ability, and a tendency to shop with a purpose
User B: Benben Wang
Moderate demand, strong financial ability, and a tendency to shop without a purpose
User C: Yan Zhang
Moderate demand, average financial ability, tend to shop without purpose

User A: Li Yun
High demand, average economic capacity, and purposeful shopping.

User B: Wang Benben
User C: Zhang Yan

Moderate demand, strong economic capacity, and a tendency toward casual shopping.
Moderate demand, average economic capacity, and a tendency toward casual shopping.
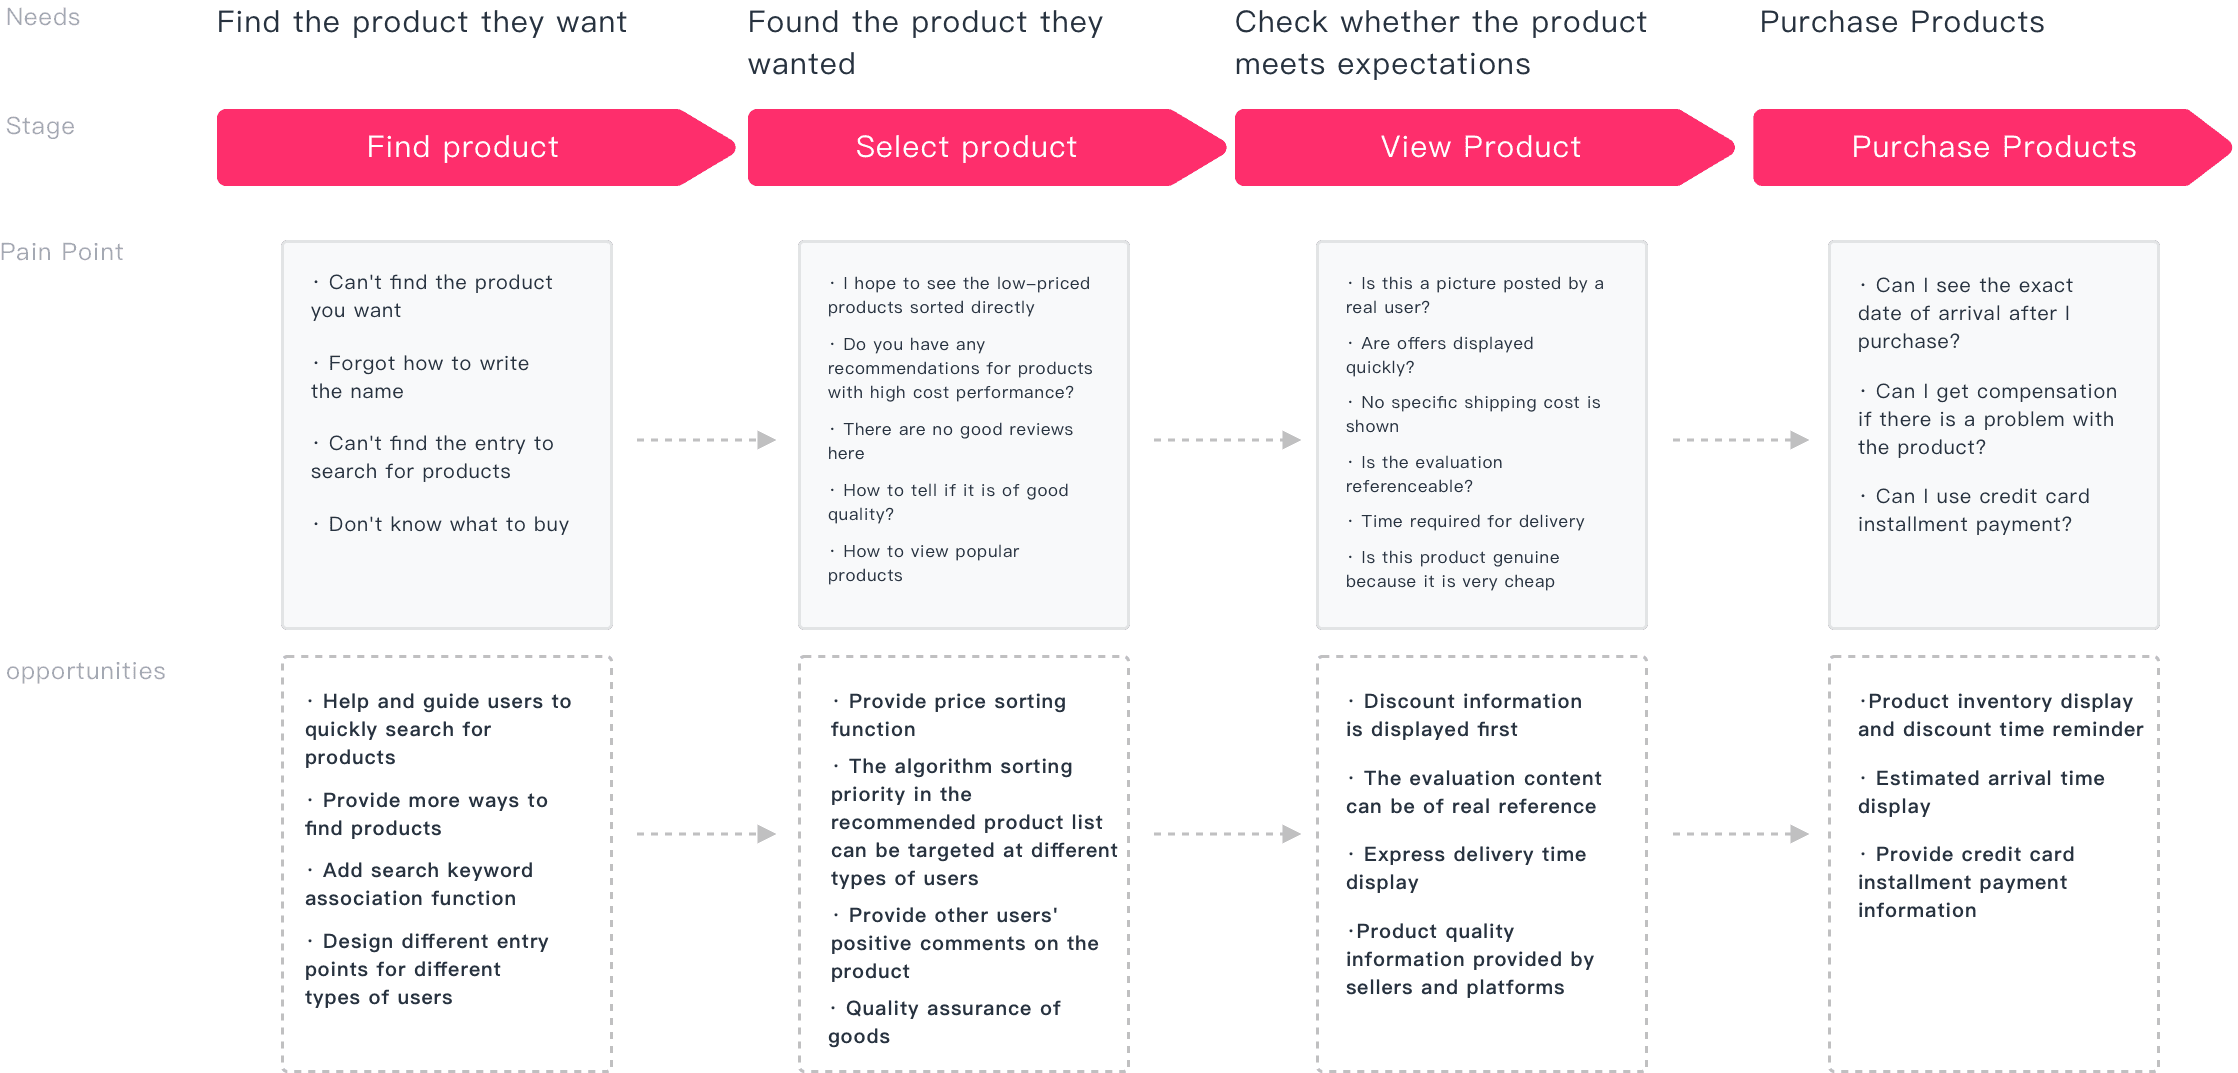
Summary of Pain Points and Problem Discovery in the User Journey
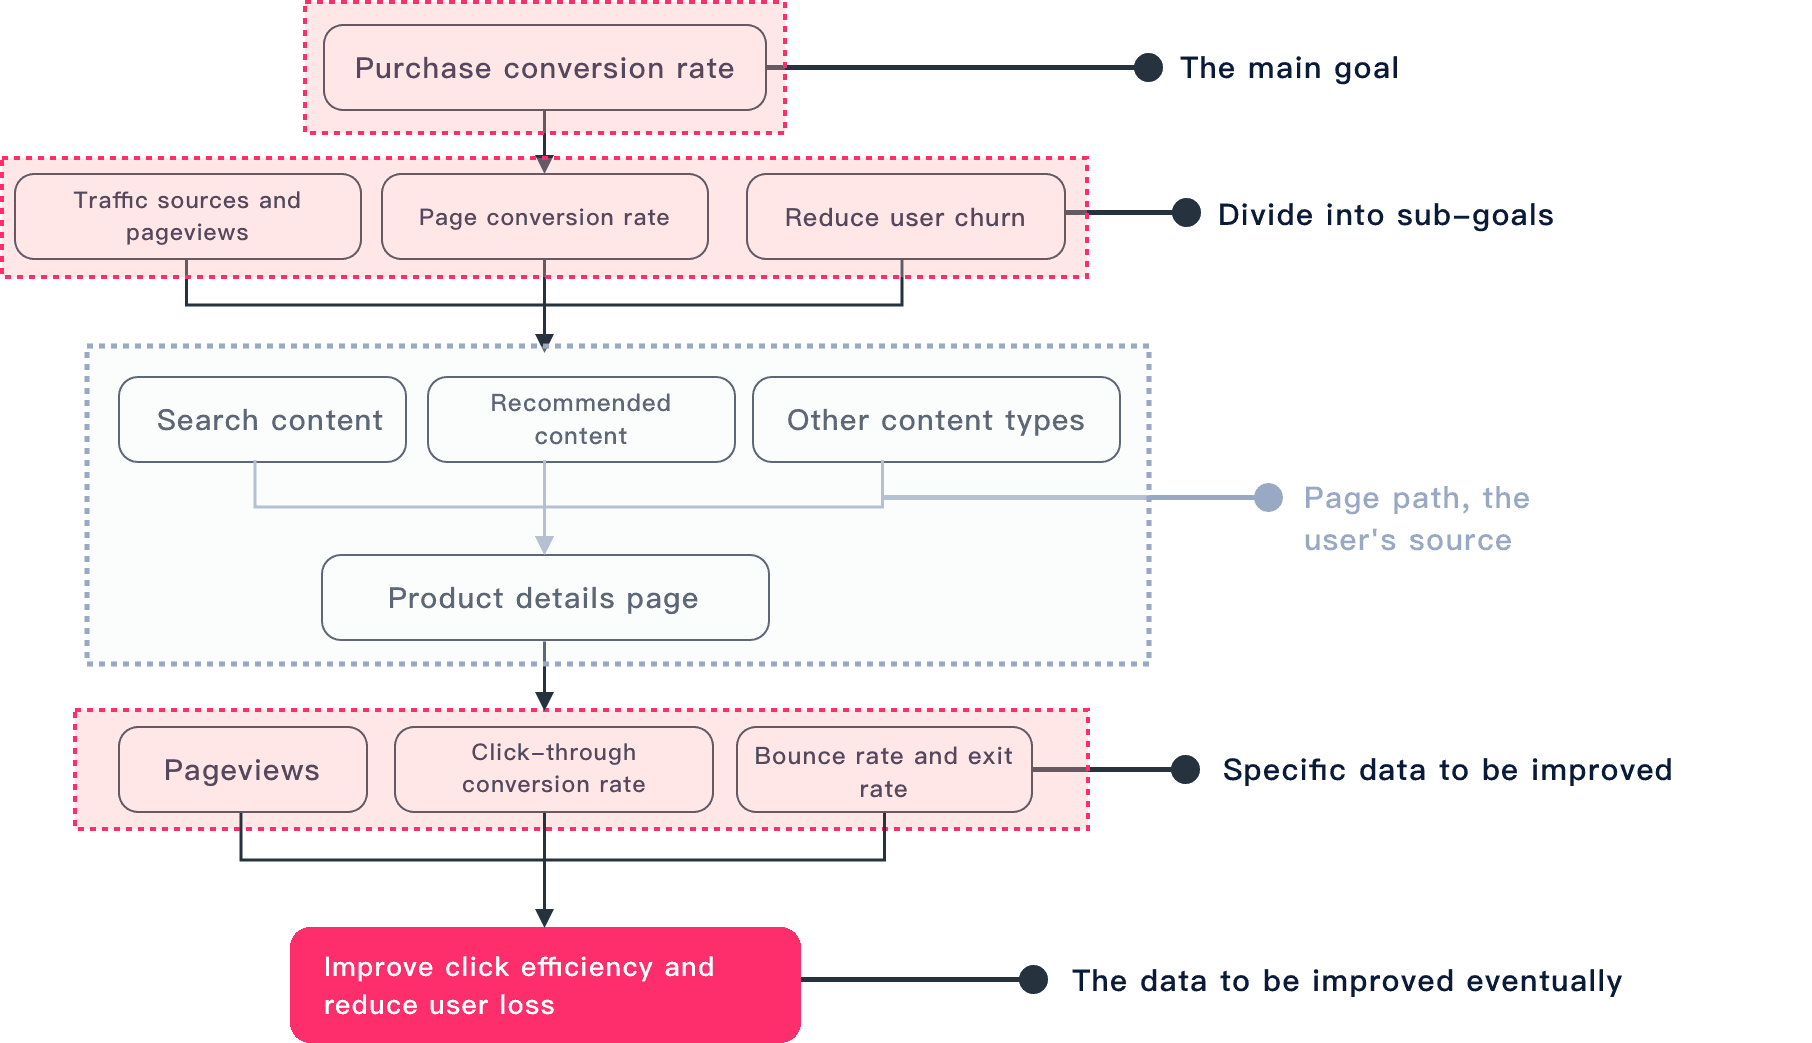
Review and Redefine Goals
Reframe
Deduce User Interaction Path
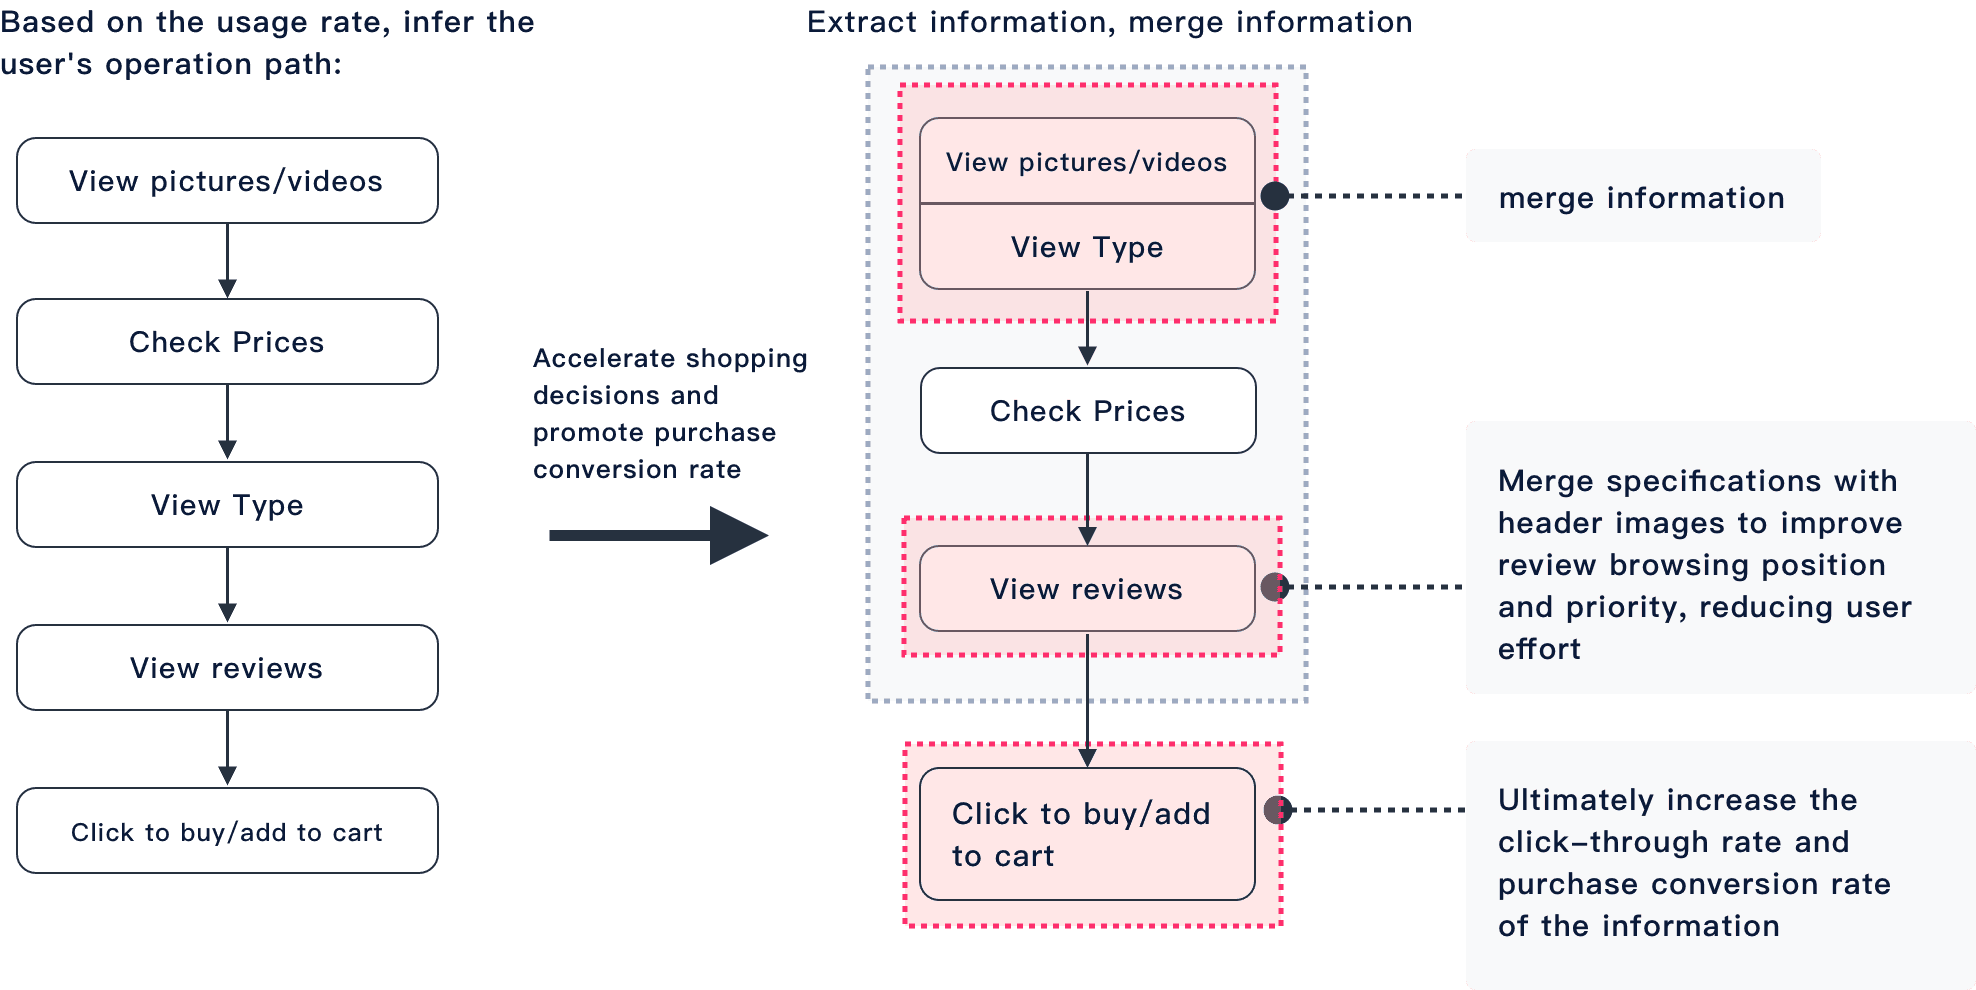
Reanalyze the information architecture, then perform information decoupling and aggregation.

Create
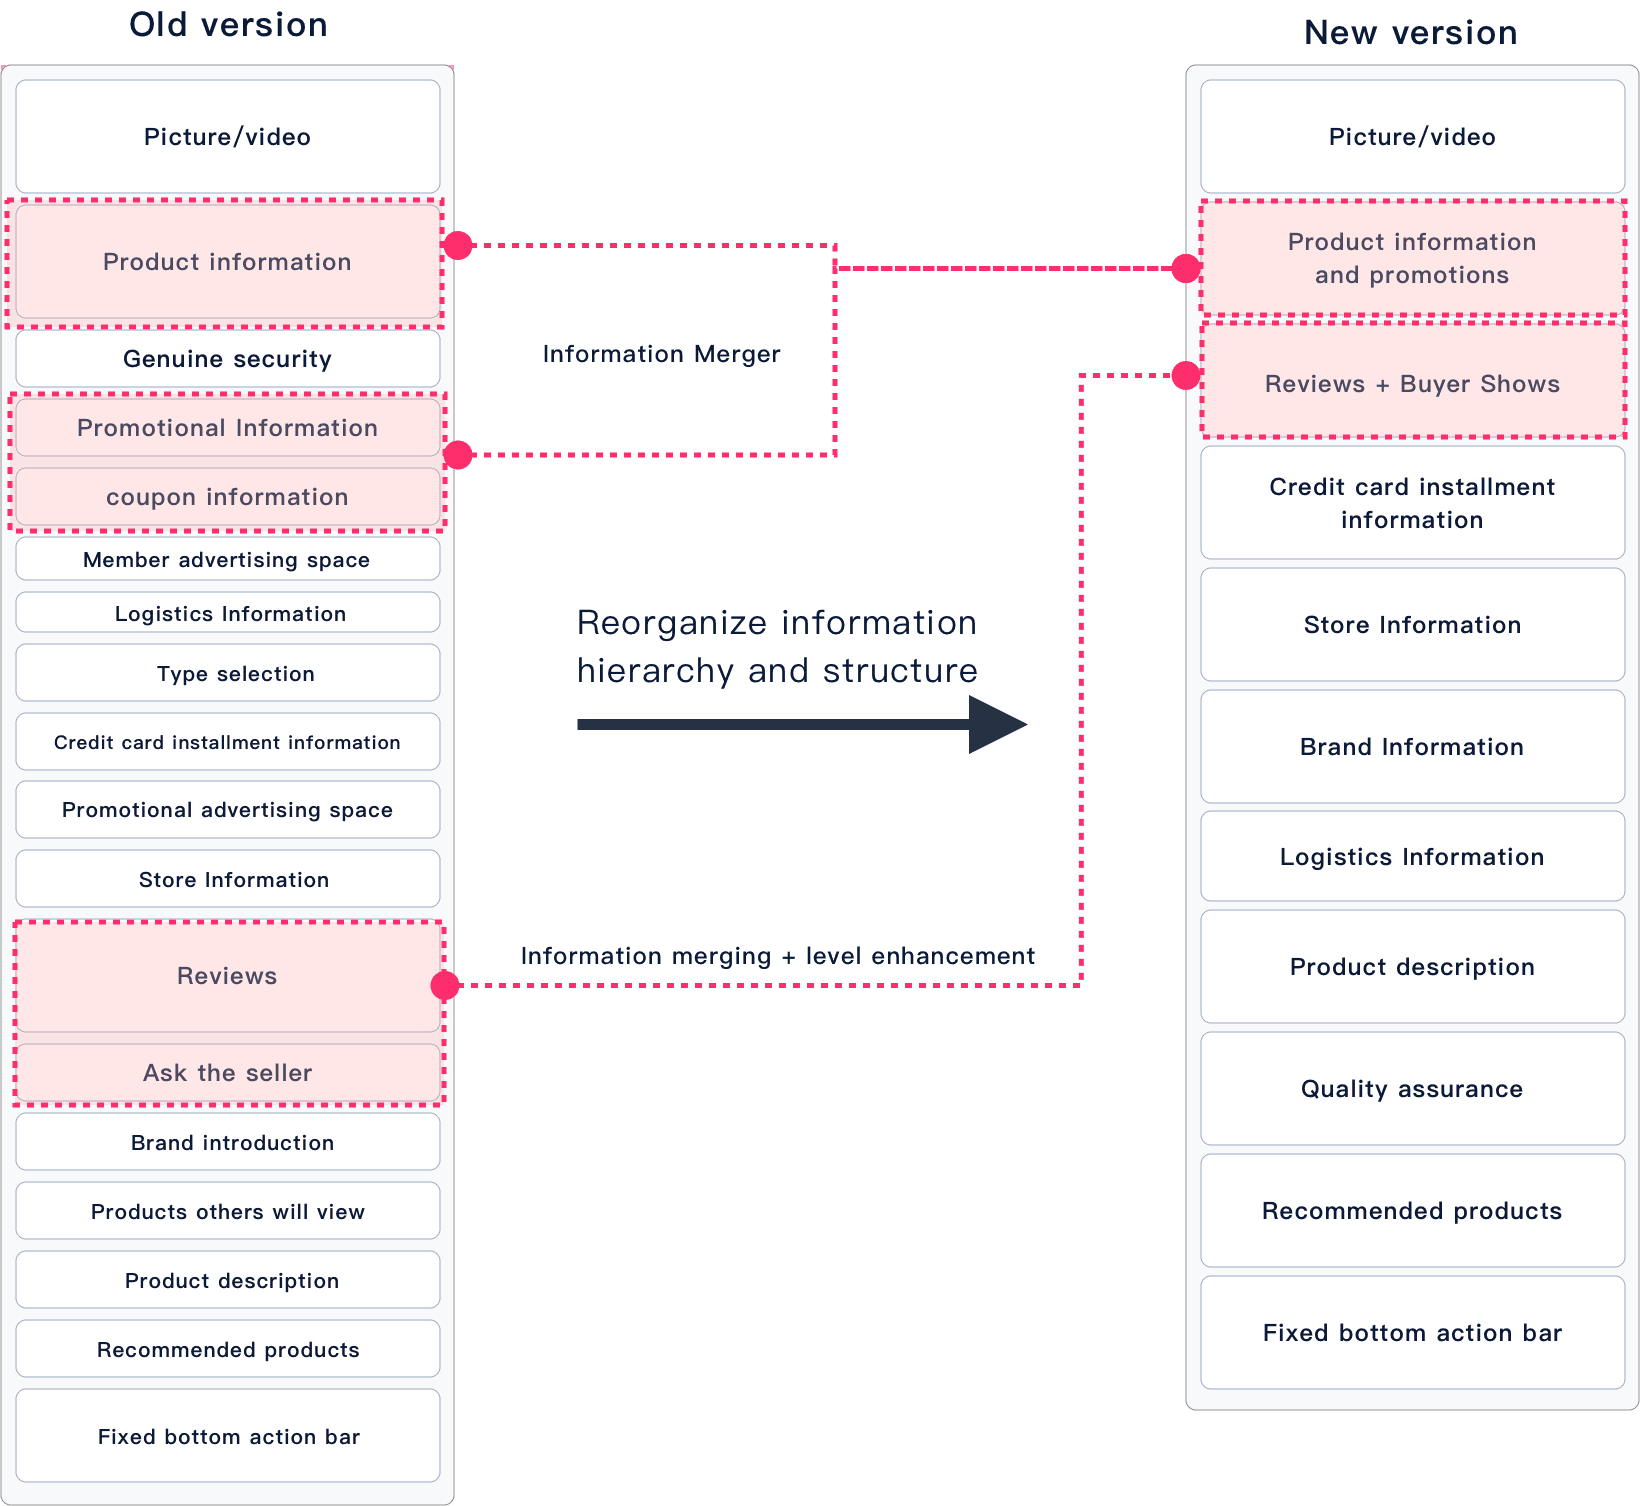
Reorganize the Information Framework
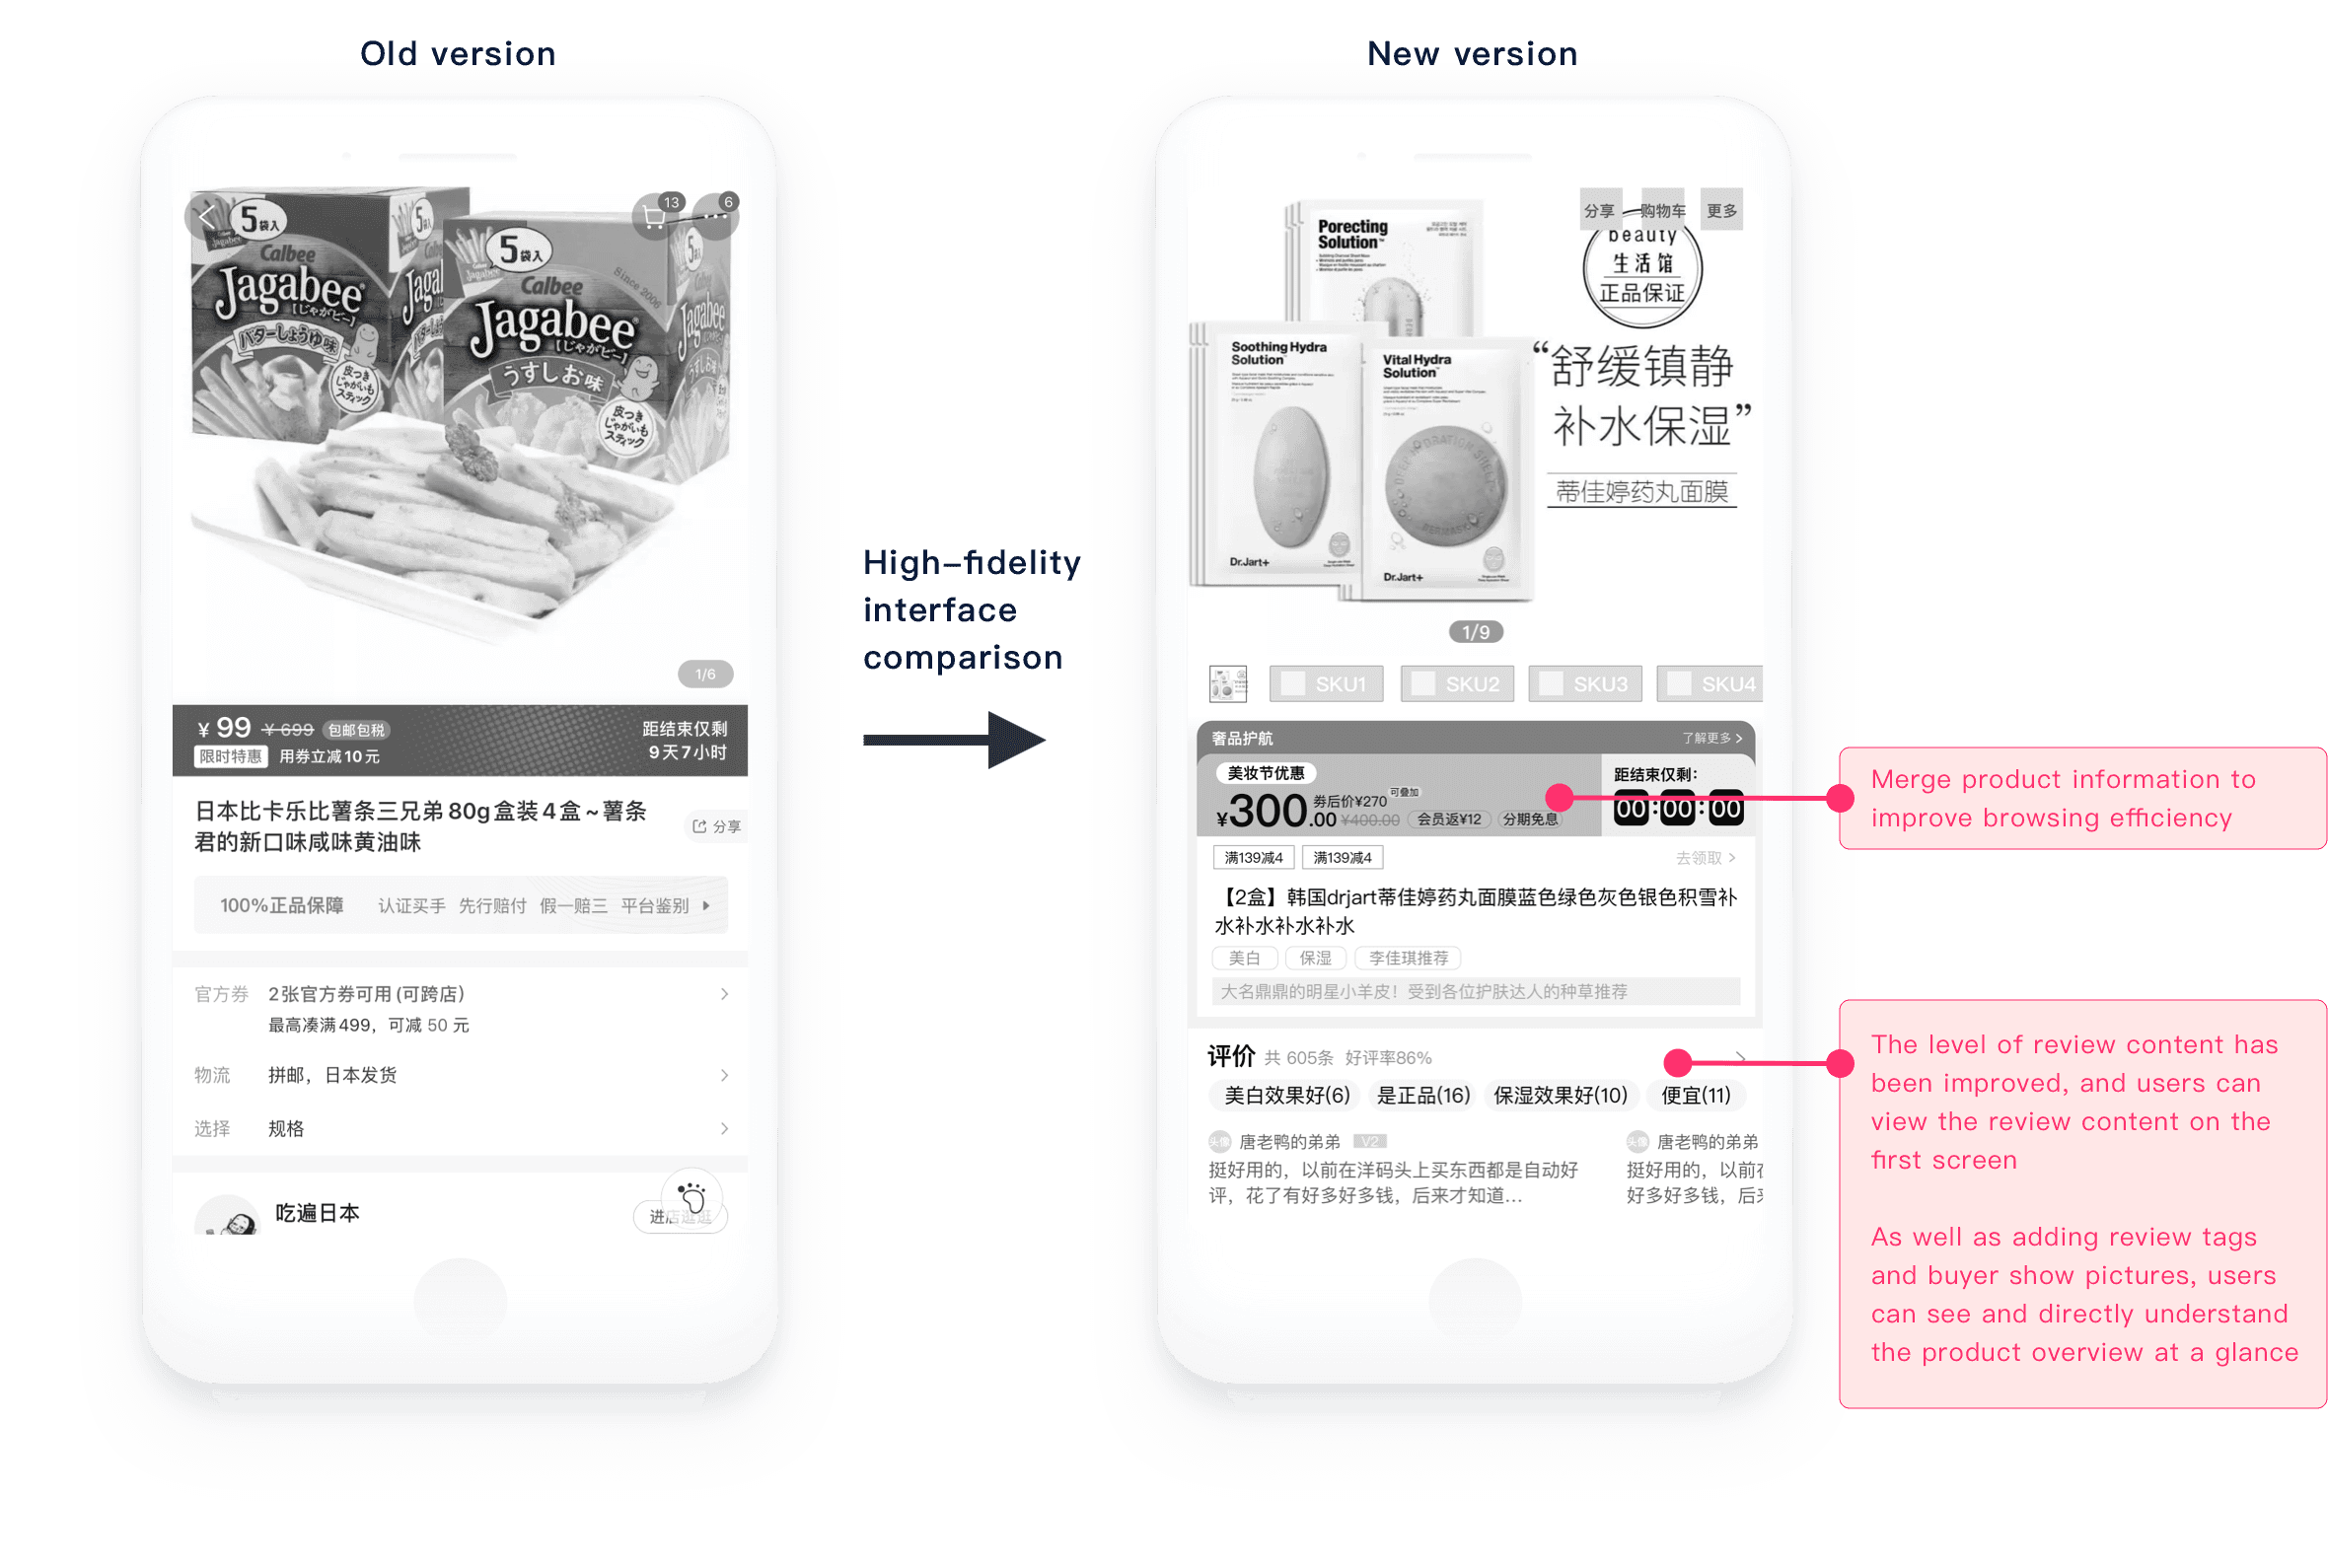
Prototype Design Comparison
Verify
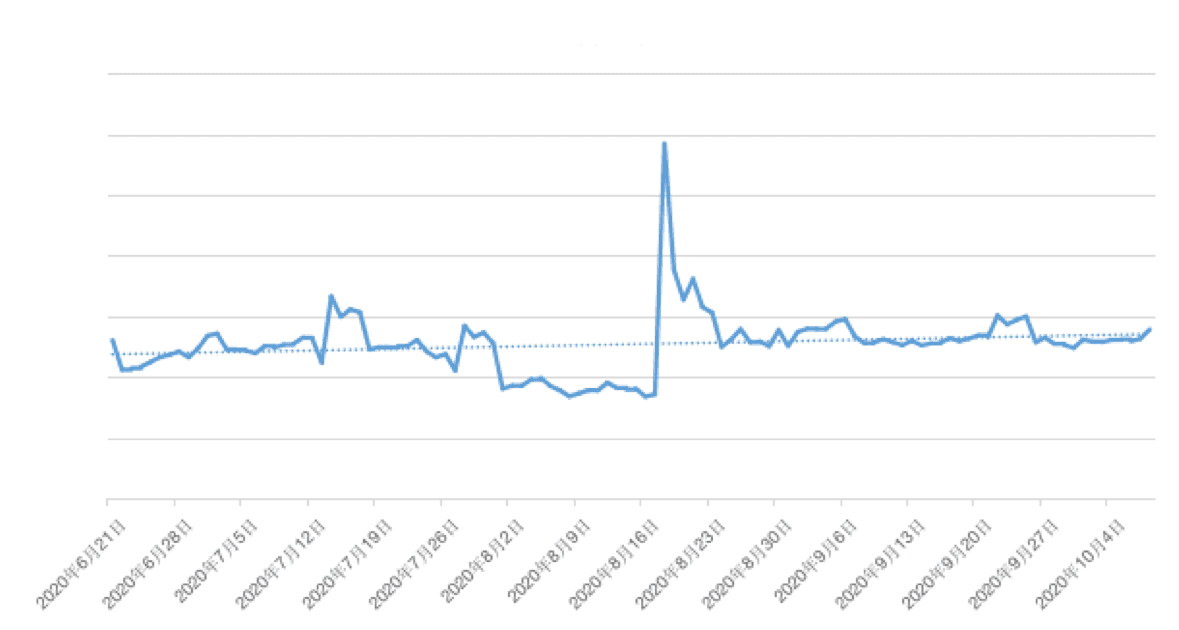
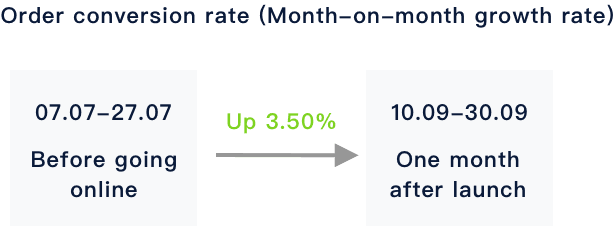
Post-launch result validation and comparison of click-through rate and conversion rate.

Summary: Through the conversion funnel based on right-side click UV, we can see that the click-to-purchase conversion rate has improved, accelerating users’ purchase decisions.
Compared to before the launch, the purchase rate and order conversion rate have slightly improved.
Note:
1. August is the platform discount period, and the data for this period is no longer counted. Due to the impact of the early notice of the discount, the early conversion rate will be low.
2. The value is the average of the 20 days before the revision and the 20 days after one month of launch.
Reflection